.
Cobweb plot
A cobweb plot, or Verhulst diagram is a visual tool used in the dynamical systems field of mathematics to investigate the qualitative behaviour of one dimensional iterated functions, such as the logistic map. Using a cobweb plot, it is possible to infer the long term status of an initial condition under repeated application of a map.
Method
For a given iterated function f: R → R, the plot consists of a diagonal (x = y) line and a curve representing y = f(x). To plot the behaviour of a value x0, apply the following steps.
1. Find the point on the function curve with an x-coordinate of x0. This has the coordinates (x0,f(x0)).
2. Plot horizontally across from this point to the diagonal line. This has the coordinates (f(x0),f(x0)).
3. Plot vertically from the point on the diagonal to the function curve. This has the coordinates (f(x0),f(f(x0))).
4. Repeat from step 2 as required.
Interpretation
On the cobweb plot, a stable fixed point corresponds to an inward spiral, while an unstable fixed point is an outward one. A period 2 orbit is represented by a rectangle, whilst greater period cycles produce further, more complex closed loops. A chaotic orbit would show a 'filled out' area, indicating an infinite number of non-repeating values.
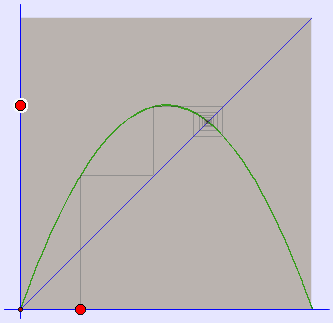
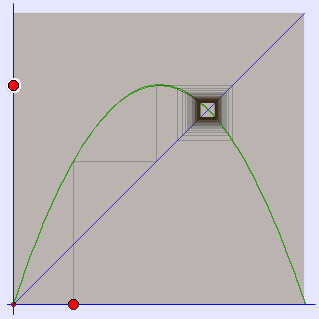
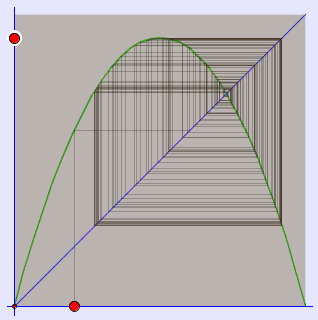
Logistic map, ![]() , Cobweb plots, r = 2.8, 3 (1 and 2 fixpoints, below for r = 3.68
, Cobweb plots, r = 2.8, 3 (1 and 2 fixpoints, below for r = 3.68
Undergraduate Texts in Mathematics
Graduate Studies in Mathematics
Retrieved from "http://en.wikipedia.org/"
All text is available under the terms of the GNU Free Documentation License