
.
Phylogenetic tree
A phylogenetic tree or evolutionary tree is a branching diagram or "tree" showing the inferred evolutionary relationships among various biological species or other entities based upon similarities and differences in their physical and/or genetic characteristics. The taxa joined together in the tree are implied to have descended from a common ancestor. In a rooted phylogenetic tree, each node with descendants represents the inferred most recent common ancestor of the descendants, and the edge lengths in some trees may be interpreted as time estimates. Each node is called a taxonomic unit. Internal nodes are generally called hypothetical taxonomic units (HTUs) as they cannot be directly observed. Trees are useful in fields of biology such as systematics and comparative phylogenetics.
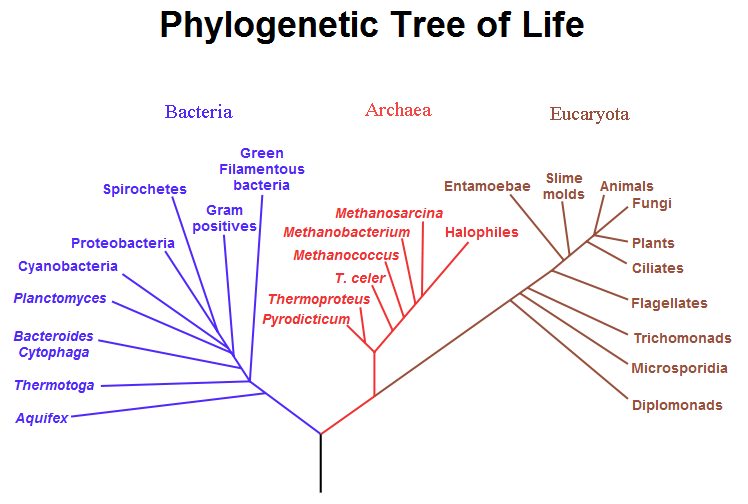
A speculatively rooted tree for rRNA genes
History
The idea of a "tree of life" arose from ancient notions of a ladder-like progression from lower to higher forms of life (such as in the Great Chain of Being). Early representations of branching phylogenetic trees include a "Paleontological chart" showing the geological relationships among plants and animals in the book Elementary Geology, by Edward Hitchcock (first edition: 1840).
Charles Darwin (1859) also produced one of the first illustrations and crucially popularized the notion of an evolutionary "tree" in his seminal book The Origin of Species. Over a century later, evolutionary biologists still use tree diagrams to depict evolution because such diagrams effectively convey the concept that speciation occurs through the adaptive and random splitting of lineages. Over time, species classification has become less static and more dynamic.
Types

Fig. 1: Unrooted tree of the myosin supergene family[1] (*)

Fig. 2: A highly resolved, automatically generated Tree Of Life, based on completely sequenced genomes [2][3].
A phylogenetic tree, showing how Eukaryota and Archaea are more closely related to each other than to Bacteria, based on Cavalier-Smith's theory of bacterial evolution. (Cf. LUCA, Neomura.)
A rooted phylogenetic tree is a directed tree with a unique node corresponding to the (usually imputed) most recent common ancestor of all the entities at the leaves of the tree. The most common method for rooting trees is the use of an uncontroversial outgroup — close enough to allow inference from sequence or trait data, but far enough to be a clear outgroup.
Unrooted trees illustrate the relatedness of the leaf nodes without making assumptions about ancestry at all. While unrooted trees can always be generated from rooted ones by simply omitting the root, a root cannot be inferred from an unrooted tree without some means of identifying ancestry; this is normally done by including an outgroup in the input data or introducing additional assumptions about the relative rates of evolution on each branch, such as an application of the molecular clock hypothesis. Figure 1 depicts an unrooted phylogenetic tree for myosin, a superfamily of proteins.[4]
Both rooted and unrooted phylogenetic trees can be either bifurcating or multifurcating, and either labeled or unlabeled. A rooted bifurcating tree has exactly two descendants arising from each interior node (that is, it forms a binary tree), and an unrooted bifurcating tree takes the form of an unrooted binary tree, a free tree with exactly three neighbors at each internal node. In contrast, a rooted multifurcating tree may have more than two children at some nodes and an unrooted multifurcating tree may have more than three neighbors at some nodes. A labeled tree has specific values assigned to its leaves, while an unlabeled tree, sometimes called a tree shape, defines a topology only. The number of possible trees for a given number of leaf nodes depends on the specific type of tree, but there are always more multifurcating than bifurcating trees, more labeled than unlabeled trees, and more rooted than unrooted trees. The last distinction is the most biologically relevant; it arises because there are many places on an unrooted tree to put the root. For labeled bifurcating trees, there are
(2n-3)!! = (2n-3)! /2 (n-2)(n-2)! for n >= 2
total rooted trees and
(2n-5)!! = (2n-5)! / 2^ (n-3) (n-3)! for n >= 3
total unrooted trees, where n represents the number of leaf nodes. Among labeled bifurcating trees, the number of unrooted trees with n leaves is equal to the number of rooted trees with n − 1 leaves.[5]
A dendrogram is a broad term for the diagrammatic representation of a phylogenetic tree.
A cladogram is a tree formed using cladistic methods. This type of tree only represents a branching pattern, i.e., its branch lengths do not represent time.
A phylogram is a phylogenetic tree that explicitly represents number of character changes through its branch lengths.
A chronogram is a phylogenetic tree that explicitly represents evolutionary time through its branch lengths.
Construction
Main article: Computational phylogenetics
Phylogenetic trees among a nontrivial number of input sequences are constructed using computational phylogenetics methods. Distance-matrix methods such as neighbor-joining or UPGMA, which calculate genetic distance from multiple sequence alignments, are simplest to implement, but do not invoke an evolutionary model. Many sequence alignment methods such as ClustalW also create trees by using the simpler algorithms (i.e. those based on distance) of tree construction. Maximum parsimony is another simple method of estimating phylogenetic trees, but implies an implicit model of evolution (i.e. parsimony). More advanced methods use the optimality criterion of maximum likelihood, often within a Bayesian Framework, and apply an explicit model of evolution to phylogenetic tree estimation.[5] Identifying the optimal tree using many of these techniques is NP-hard[5], so heuristic search and optimization methods are used in combination with tree-scoring functions to identify a reasonably good tree that fits the data.
Tree-building methods can be assessed on the basis of several criteria:[6]
* efficiency (how long does it take to compute the answer, how much memory does it need?)
* power (does it make good use of the data, or is information being wasted?)
* consistency (will it converge on the same answer repeatedly, if each time given different data for the same model problem?)
* robustness (does it cope well with violations of the assumptions of the underlying model?)
* falsifiability (does it alert us when it is not good to use, i.e. when assumptions are violated?)
Tree-building techniques have also gained the attention of mathematicians. Trees can also be built using T-theory.[7]
Limitations
Although phylogenetic trees produced on the basis of sequenced genes or genomic data in different species can provide evolutionary insight, they have important limitations. They do not necessarily accurately represent the species evolutionary history. The data on which they are based is noisy; the analysis can be confounded by horizontal gene transfer[8], hybridisation between species that were not nearest neighbors on the tree before hybridisation takes place, convergent evolution, and conserved sequences.
Also, there are problems in basing the analysis on a single type of character, such as a single gene or protein or only on morphological analysis, because such trees constructed from another unrelated data source often differ from the first, and therefore great care is needed in inferring phylogenetic relationships among species. This is most true of genetic material that is subject to lateral gene transfer and recombination, where different haplotype blocks can have different histories. In general, the output tree of a phylogenetic analysis is an estimate of the character's phylogeny (i.e. a gene tree) and not the phylogeny of the taxa (i.e. species tree) from which these characters were sampled, though ideally, both should be very close. For this reason, serious phylogenetic studies generally use a combination of genes that come from different genomic sources (e.g., from mitochondrial or plastid vs. nuclear genomes), or genes that would be expected to evolve under different selective regimes, so that homoplasy (false homology) would be unlikely to result from natural selection.
When extinct species are included in a tree, they are terminal nodes, as it is unlikely that they are direct ancestors of any extant species. Scepticism must apply when extinct species are included in trees that are wholly or partly based on DNA sequence data, due to the fact that little useful "ancient DNA" is preserved for longer than 100,000 years, and except in the most unusual circumstances no DNA sequences long enough for use in phylogenetic analyses have yet been recovered from material over 1 million years old.
In some organisms, endosymbionts have an independent genetic history from the host.[9]
Phylogenetic networks are used when bifurcating trees are not suitable, due to these complications which suggest a more reticulate evolutionary history of the organisms sampled.
See also
The "tree of life"
* Evolutionary history of life - An overview of the major time periods of life on earth
* Life -
* Three-domain system (cell types)
Fields of study
* Archaeopteryx
* Cladistics
* Comparative phylogenetics
* Computational phylogenetics
* Evolutionary biology
* Phylogenetics
References
1. ^ Hodge T, Cope M (1 October 2000). "A myosin family tree". J Cell Sci 113 Pt 19 (19): 3353–4. PMID 10984423. http://jcs.biologists.org/cgi/content/full/113/19/3353.
2. ^ Letunic, I; Bork, P (2007). "Interactive Tree Of Life (iTOL): an online tool for phylogenetic tree display and annotation." (Pubmed). Bioinformatics 23(1) (1): 127–8. doi:10.1093/bioinformatics/btl529. PMID 17050570.
3. ^ Ciccarelli, FD; Doerks, T; Von Mering, C; Creevey, CJ; Snel, B; Bork, P (2006). "Toward automatic reconstruction of a highly resolved tree of life." (Pubmed). Science 311(5765) (5765): 1283–7. doi:10.1126/science.1123061. PMID 16513982.
4. ^ Maher BA (2002). "Uprooting the Tree of Life". The Scientist 16: 18. http://www.the-scientist.com/yr2002/sep/research1_020916.html.
5. ^ a b c Felsenstein J. (2004). Inferring Phylogenies Sinauer Associates: Sunderland, MA.
6. ^ Penny, D., Hendy, M. D. & M. A. Steel. 1992. Progress with methods for constructing evolutionary trees. Trends in Ecology and Evolution 7: 73-79.
7. ^ A. Dress, K. T. Huber, and V. Moulton. 2001. Metric Spaces in Pure and Applied Mathematics. Documenta Mathematica LSU 2001: 121-139
8. ^ Woese C (2002). "On the evolution of cells". Proc Natl Acad Sci USA 99 (13): 8742–7. doi:10.1073/pnas.132266999. PMID 12077305.
9. ^ Villarreal, L.P., & Witzany, G. (2010). Viruses are Essential Agents within the Roots and Stem of the Tree of Life. Journal of Theoretical Biology 262: 698-710.
Further reading
* Schuh, R. T. and A. V. Z. Brower. 2009. Biological Systematics: principles and applications (2nd edn.) ISBN 978-0-8014-4799-0
External links
Images
* Phylogenetic Trees Based on 16s rDNA
* Poster-sized tree of life illustration
* A 3D View
* Human Y-Chromosome 2002 Phylogenetic Tree
* In 2003, the Science journal dedicated a special issue to the tree of life, including an online version of a tree of life.
* iTOL: Interactive Tree Of Life
* Phylogenetic Tree of Artificial Organisms Evolved on Computers
General
* Discover Life An interactive tree based on the U.S. National Science Foundation's Assembling the Tree of Life Project
* PhyloCode
* A Multiple Alignment of 139 Myosin Sequences and a Phylogenetic Tree
* Tree of Life Web Project
* Aisee.com, detailed and comprehensive family tree of dinosaurs yet available
* SplitsTree
* Dendroscope
* Phylogenetic inferring on the T-REX server
* NCBI's Taxonomy Database[1]

Retrieved from "http://en.wikipedia.org/"
All text is available under the terms of the GNU Free Documentation License